[Python][Matplotlib] グモウスキー・ミラの写像を描く
はじめに
不思議な模様が現れることで有名な差分方程式系の一つに、グモウスキー・ミラの写像というものがある。
以前、PythonのMatplotlibを使って作図したコードを発見したので貼ってみる。本当はもっときれいに描きたかったのだが、Matplotlibでの方法がよく分からなかった。
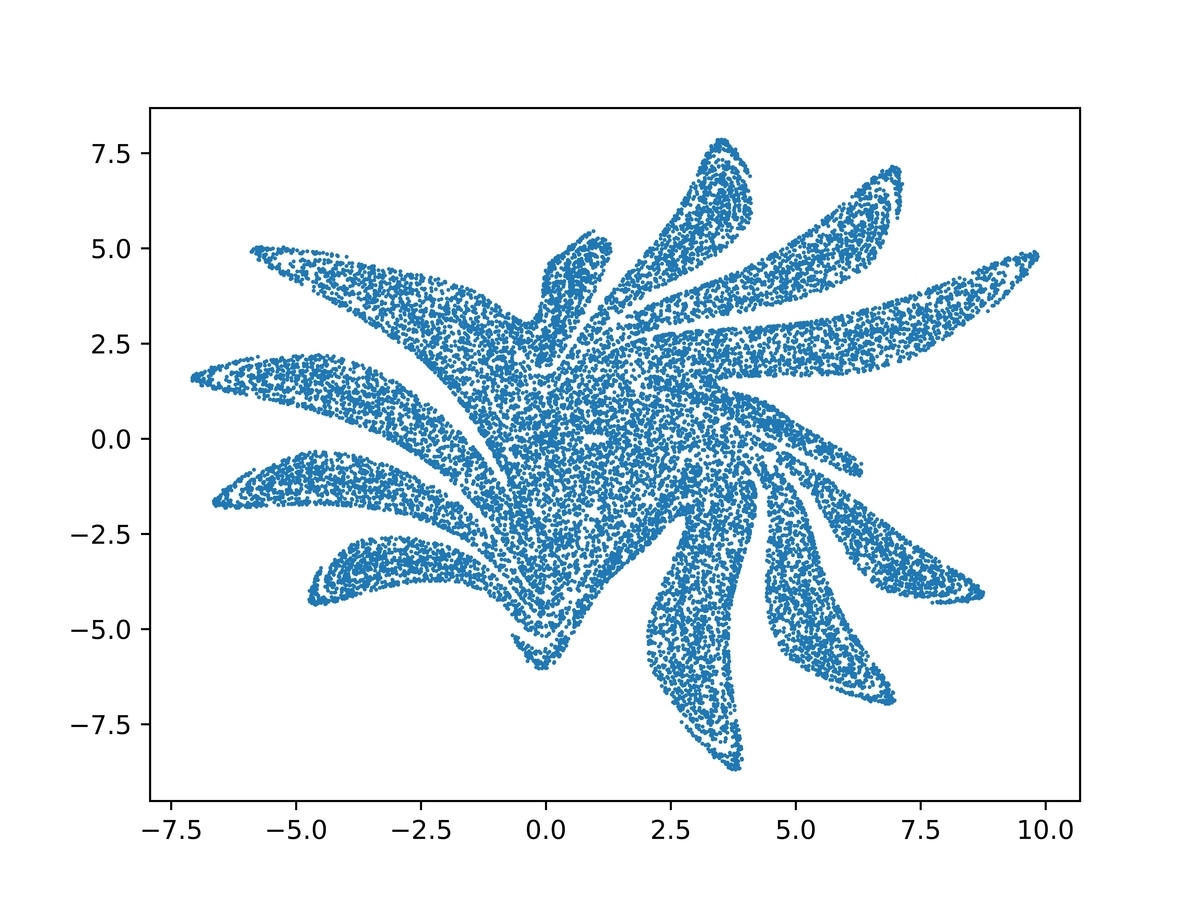
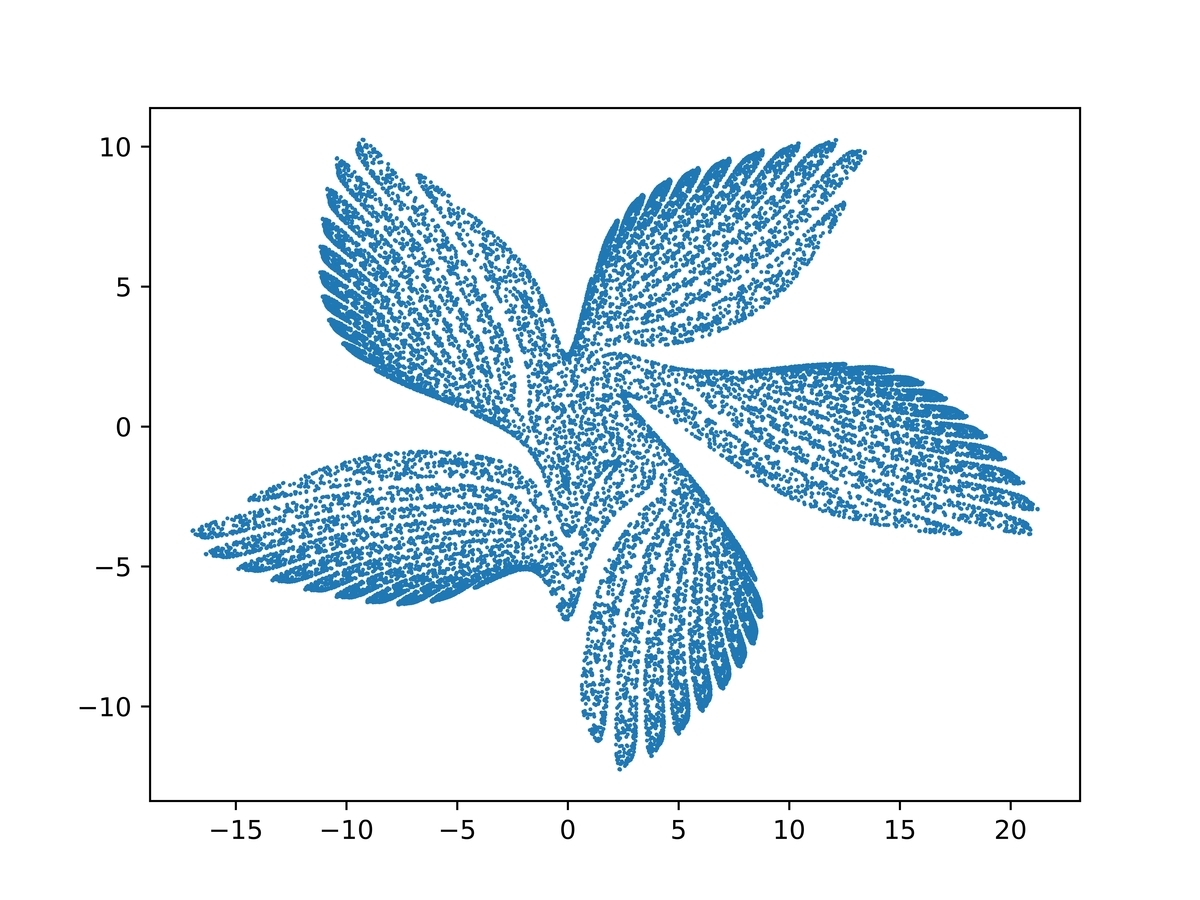
出力結果


figure2の方は、五枚の翼を持つ鳥に見えるということで、写像の提案者の一人であるミラは「神話の鳥 (mythic bird)」と呼んだらしい。
ソースコード
import os.path

import matplotlib.pyplot as plt
import numpy as np
from tqdm import tqdm


x0 = 0.1
y0 = 0.1
T = 20000
N = 1000
marker = '.'
markersize = 1
fillstyle = 'full'
DPI = 1200


def F(x, mu):
    return mu * x + 2 * (1 - mu) * x**2 / (1 + x**2)


def func(x, y, alpha, sigma, mu):
    x_next = y + alpha * (1 - sigma * y**2) * y + F(x, mu)
    y_next = - x + F(x_next, mu)
    return (x_next, y_next)


def plot_times(*, x_init, y_init, ax, N, params):
    xs, ys = [np.ones(N) for _ in range(2)]
    xs[0], ys[0] = func(x_init, y_init, **params)
    for t in np.arange(N - 1):
        xs[t + 1], ys[t + 1] = func(xs[t], ys[t], **params)
    ax.plot(
        xs, ys, fillstyle=fillstyle, markerfacecolor='C0', markeredgecolor='C0',
        marker=marker, markersize=markersize, linewidth=0
    )
    return xs[-1], ys[-1]


def plot(params, T, filename):
    x, y = (x0, y0)
    fig = plt.figure()
    ax = fig.add_subplot(111)
    ax.plot(x, y)

    times_now = 0
    while True:
        if times_now >= T:
            break
        elif times_now + N < T:
            x, y = plot_times(x_init=x, y_init=y, N=N, ax=ax, params=params)
            times_now += N
        elif (times_now < T) and (times_now + N >= T):
            n = T - times_now
            x, y = plot_times(x_init=x, y_init=y, N=n, ax=ax, params=params)
            times_now += n
        else:
            raise ValueError

    fig.savefig(filename, dpi=DPI)
    return


def main():
    params = {
        'mu': -0.38,
        'alpha': 0.0083,
        'sigma': 0.1
    }
    plot(params=params, T=T, filename='figure1.jpg')
    params = {
        'mu': -0.8,
        'alpha': 0.008,
        'sigma': 0.05
    }
    plot(params=params, T=T, filename='figure2.jpg')
    return


if __name__ == '__main__':
    main()