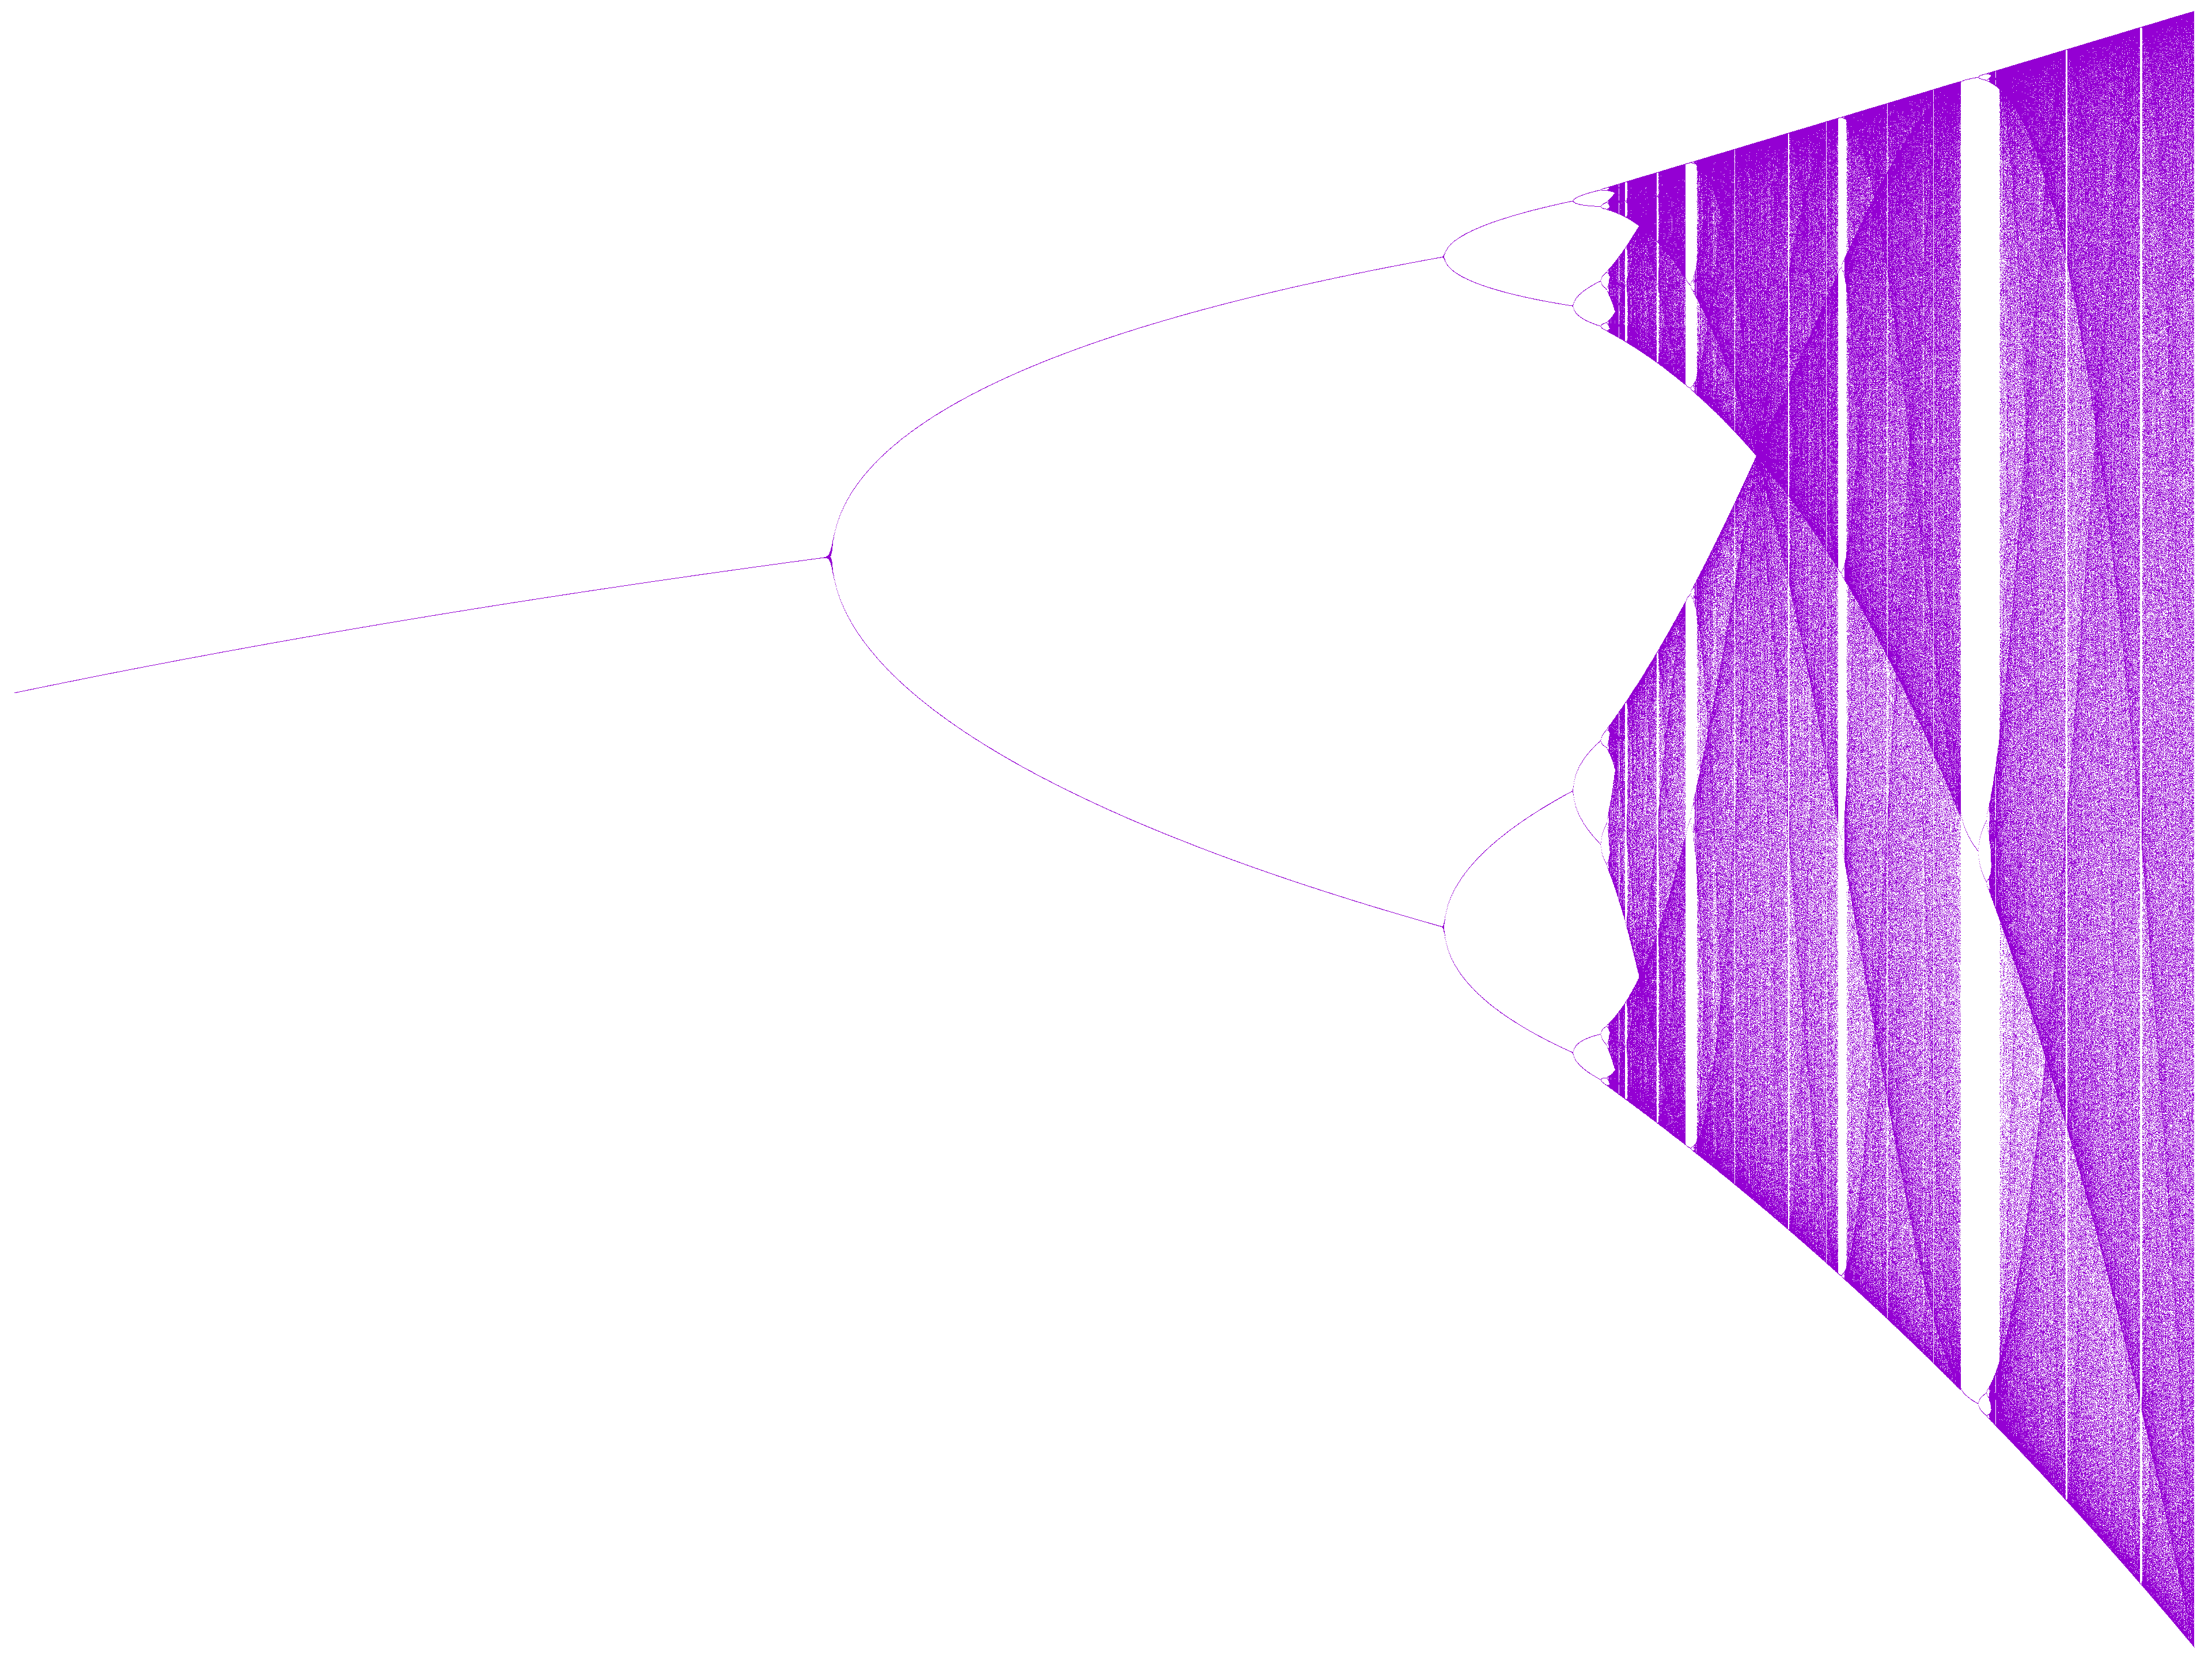
[Python][Gnuplot] ロジスティック写像の分岐図を描く
環境
Windows10 + Anaconda 4.8.1 + Python 3.7.6 + gnuplot 5.2(patchlevel 8)
はじめに
Pythonでロジスティック写像を計算し、Gnuplotを使って分岐図を描いてみた。Wikipediaの図ほど綺麗には描けなかったので気が向いたらリベンジしたい。
ロジスティック写像についてはwikiに詳しい説明がある。
ja.wikipedia.org
結果

ソースコード
実行には少し時間がかかる。自分の環境だと3分くらいかかった。
import subprocess

import numpy as np
from tqdm import tqdm


def func(x, a):
    return a * x * (1 - x)


def calc(*, a, x0, n, n_run):
    res = np.ones(n + n_run) * np.nan
    for i in range(n + n_run):
        if i == 0:
            res[i] = func(x=x0, a=a)
        else:
            res[i] = func(x=res[i - 1], a=a)
    return res[n_run:]


N = 2000
N_run = 1000
x0 = 0.5
RESOLUTION = 6000

FILENAME = 'logistic_map.csv'


def main():
    a_list = np.linspace(2.4, 4.0, RESOLUTION)
    with open(FILENAME, mode='w') as f:
        for a in tqdm(a_list):
            xs = np.ones(N) * a
            ys = calc(a=a, x0=x0, n=N, n_run=N_run)
            for x, y in zip(xs, ys):
                f.write('{:f}, {:f}\n'.format(x, y))

    cmd = '; '.join(
        [
            r'set terminal png size 3840, 2880',
            r'set output \"logistic_map_gnuplot.png\"',
            r'set datafile separator \",\"',
            r'set xrange [2.4:4.0]',
            r'set yrange [0.0:1.0]',
            r'set noborder',
            r'set noxtics',
            r'set noytics',
            r'plot \"{}\" using 1:2 notitle pt 7 ps 0.1'.format(FILENAME),
            r'exit'
        ]
    )
    cmd = 'gnuplot -e "{}"'.format(cmd)
    subprocess.run(cmd, text=True)
    return


if __name__ == '__main__':
    main()