[Python][Matplotlib] 一枚の図に複数のグラフを描く
はじめに
Matplotライブラリを使って、一枚の図に複数のグラフを描きたいときがある。ここでは二つの方法を説明する。
add_subplotメソッドを使う方法(簡単。単純なレイアウトで)Gridspecオブジェクトを使う方法(ちょっと面倒。複雑なレイアウトも可能)
1. add_subplot メソッドを使う
コード 1:
import numpy as np
import matplotlib.pyplot as plt


# test data
x = np.linspace(-5, 5, 100)
ys = np.ones(shape=(6, len(x))) * np.nan
ys[0] = 1
ys[1] = 1 + x
ys[2] = 1 + x + x**2 / 2
ys[3] = 1 + x + x**2 / 2 + x**3 / 6
ys[4] = 1 + x + x**2 / 2 + x**3 / 6 + x**4 / 24
ys[5] = 1 + x + x**2 / 2 + x**3 / 6 + x**4 / 24 + x**5 / 120

# plot
fig = plt.figure()
axs = [fig.add_subplot(2, 3, i + 1) for i in range(6)]
for i in range(6):
    axs[i].plot(x, ys[i], color='C0', zorder=5)
    axs[i].plot(x, np.exp(x), color='darkgray', linestyle='dashed', zorder=4)
    axs[i].set_title('plot {}'.format(i))
fig.tight_layout()

# save
fig.savefig('multiple_plot1.jpg', dpi=600)
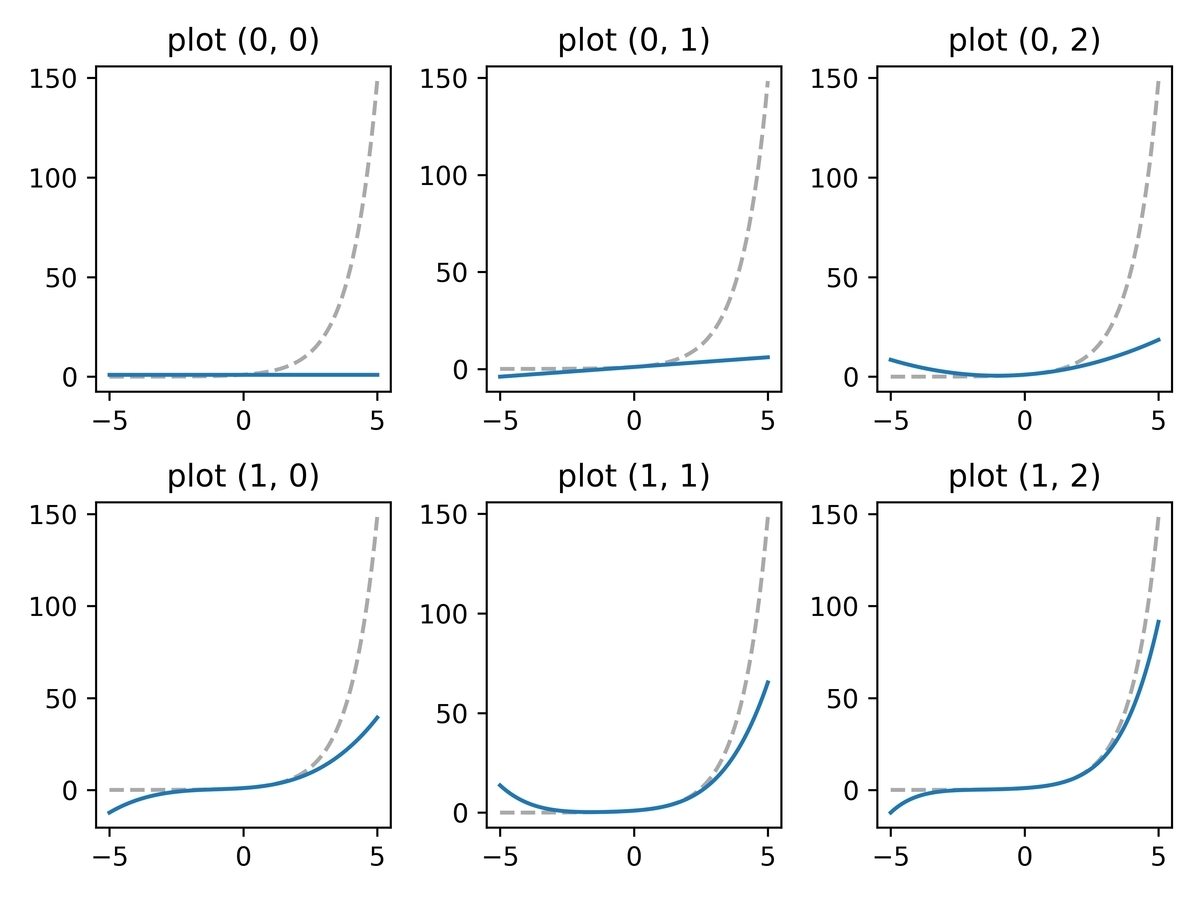
出力 1:

2. Gridspec オブジェクトを使う
コード 2:
import numpy as np
import matplotlib.pyplot as plt
import matplotlib.gridspec as gridspec


# test data
x = np.linspace(-5, 5, 100)
ys = np.ones(shape=(6, len(x))) * np.nan
ys[0] = 1
ys[1] = 1 + x
ys[2] = 1 + x + x**2 / 2
ys[3] = 1 + x + x**2 / 2 + x**3 / 6
ys[4] = 1 + x + x**2 / 2 + x**3 / 6 + x**4 / 24
ys[5] = 1 + x + x**2 / 2 + x**3 / 6 + x**4 / 24 + x**5 / 120

# plot
fig = plt.figure()
gs = gridspec.GridSpec(nrows=2, ncols=3, figure=fig)
for i in range(2):
    for j in range(3):
        ax = fig.add_subplot(gs[i, j])
        ax.plot(x, ys[3 * i + j], color='C0', zorder=5)
        ax.plot(x, np.exp(x), color='darkgray', linestyle='dashed', zorder=4)
        ax.set_title('plot ({}, {})'.format(i, j))
fig.tight_layout()

# save
fig.savefig('multiple_plot2.jpg', dpi=600)
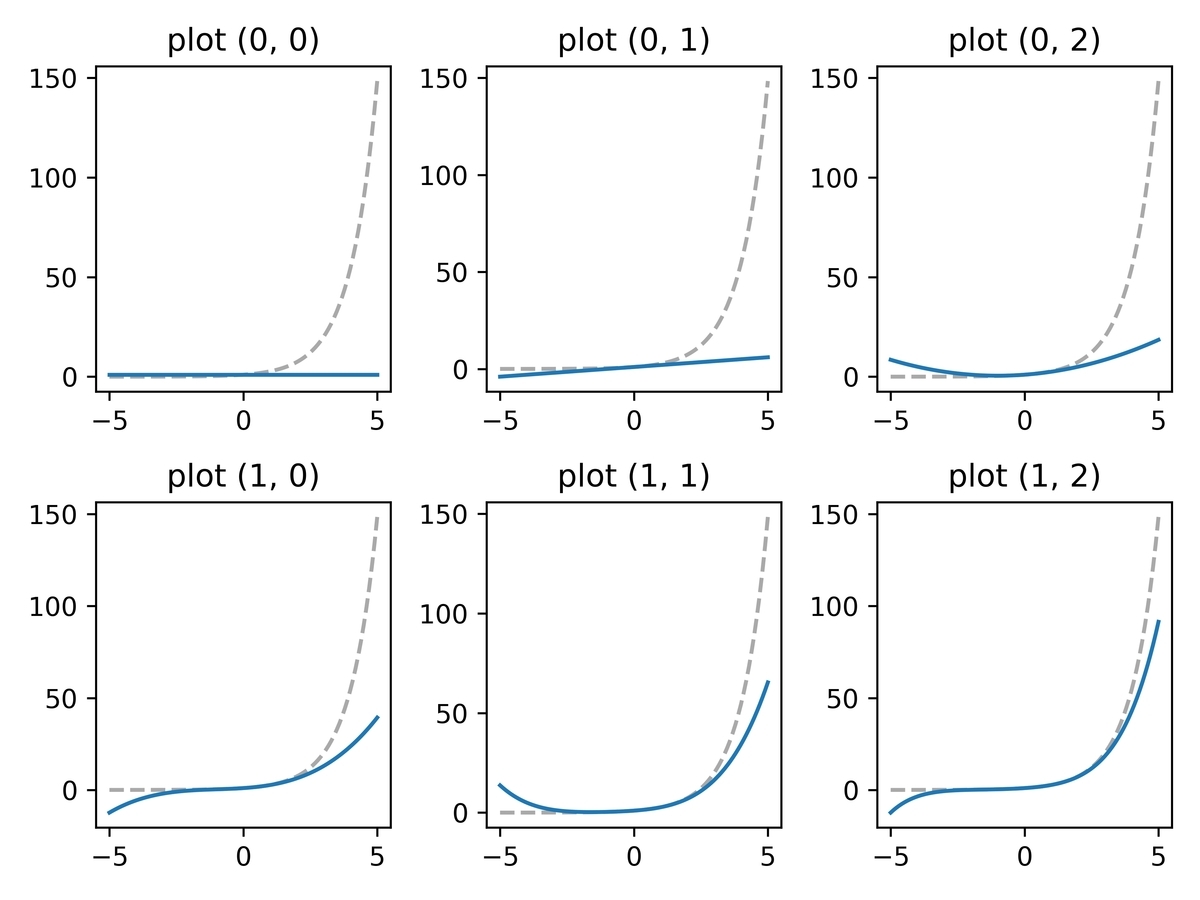
出力 2:

3. Gridspecを使えば複雑なレイアウトも可能
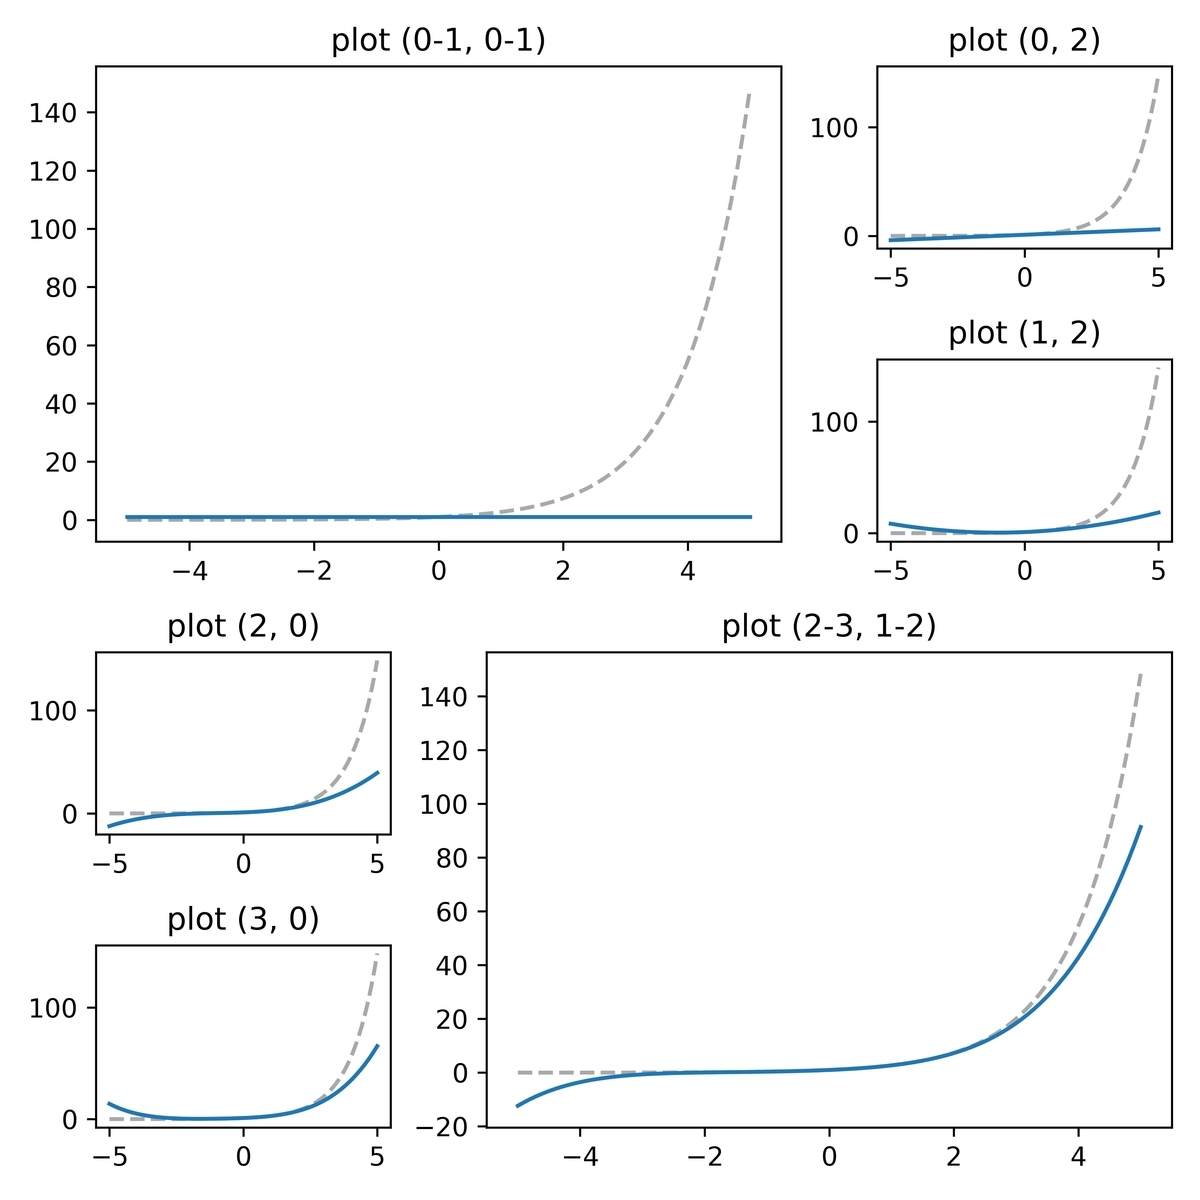
Gridspecを使うと、add_subplotメソッドでは難しいような複雑なレイアウトも簡単に作ることができる。
コード 3:
import numpy as np
import matplotlib.pyplot as plt
import matplotlib.gridspec as gridspec


# test data
x = np.linspace(-5, 5, 100)
ys = np.ones(shape=(6, len(x))) * np.nan
ys[0] = 1
ys[1] = 1 + x
ys[2] = 1 + x + x**2 / 2
ys[3] = 1 + x + x**2 / 2 + x**3 / 6
ys[4] = 1 + x + x**2 / 2 + x**3 / 6 + x**4 / 24
ys[5] = 1 + x + x**2 / 2 + x**3 / 6 + x**4 / 24 + x**5 / 120

# plot
fig = plt.figure(figsize=(6.4, 6.4))
gs = gridspec.GridSpec(nrows=4, ncols=3, figure=fig)

ax = fig.add_subplot(gs[0:2, 0:2])
ax.plot(x, ys[0], color='C0', zorder=5)
ax.plot(x, np.exp(x), color='darkgray', linestyle='dashed', zorder=4)
ax.set_title('plot (0-1, 0-1)')

ax = fig.add_subplot(gs[0, 2])
ax.plot(x, ys[1], color='C0', zorder=5)
ax.plot(x, np.exp(x), color='darkgray', linestyle='dashed', zorder=4)
ax.set_title('plot (0, 2)')

ax = fig.add_subplot(gs[1, 2])
ax.plot(x, ys[2], color='C0', zorder=5)
ax.plot(x, np.exp(x), color='darkgray', linestyle='dashed', zorder=4)
ax.set_title('plot (1, 2)')

ax = fig.add_subplot(gs[2, 0])
ax.plot(x, ys[3], color='C0', zorder=5)
ax.plot(x, np.exp(x), color='darkgray', linestyle='dashed', zorder=4)
ax.set_title('plot (2, 0)')

ax = fig.add_subplot(gs[3, 0])
ax.plot(x, ys[4], color='C0', zorder=5)
ax.plot(x, np.exp(x), color='darkgray', linestyle='dashed', zorder=4)
ax.set_title('plot (3, 0)')

ax = fig.add_subplot(gs[2:, 1:])
ax.plot(x, ys[5], color='C0', zorder=5)
ax.plot(x, np.exp(x), color='darkgray', linestyle='dashed', zorder=4)
ax.set_title('plot (2-3, 1-2)')
fig.tight_layout()

# save
fig.savefig('multiple_plot3.jpg', dpi=600)
出力 3:

まとめ
レイアウトの複雑さによって、add_subplotメソッドを使うシンプルな方法と、Gridspecオブジェクトを使うやや複雑な方法を使い分ければ良いと思う。
慣れてくればGridspecオブジェクトを使う方が楽ら上に拡張性も高いので、徐々にGridspecオブジェクトの方法に乗り換えていっても良いと思う。