[Python][Matplotlib] sin(x)のマクローリン展開のGIFアニメーションを作る Making GIF animation of Maclaurin series of sin(x)
sin(x)のマクローリン展開 Maclaurin series of sin(x)
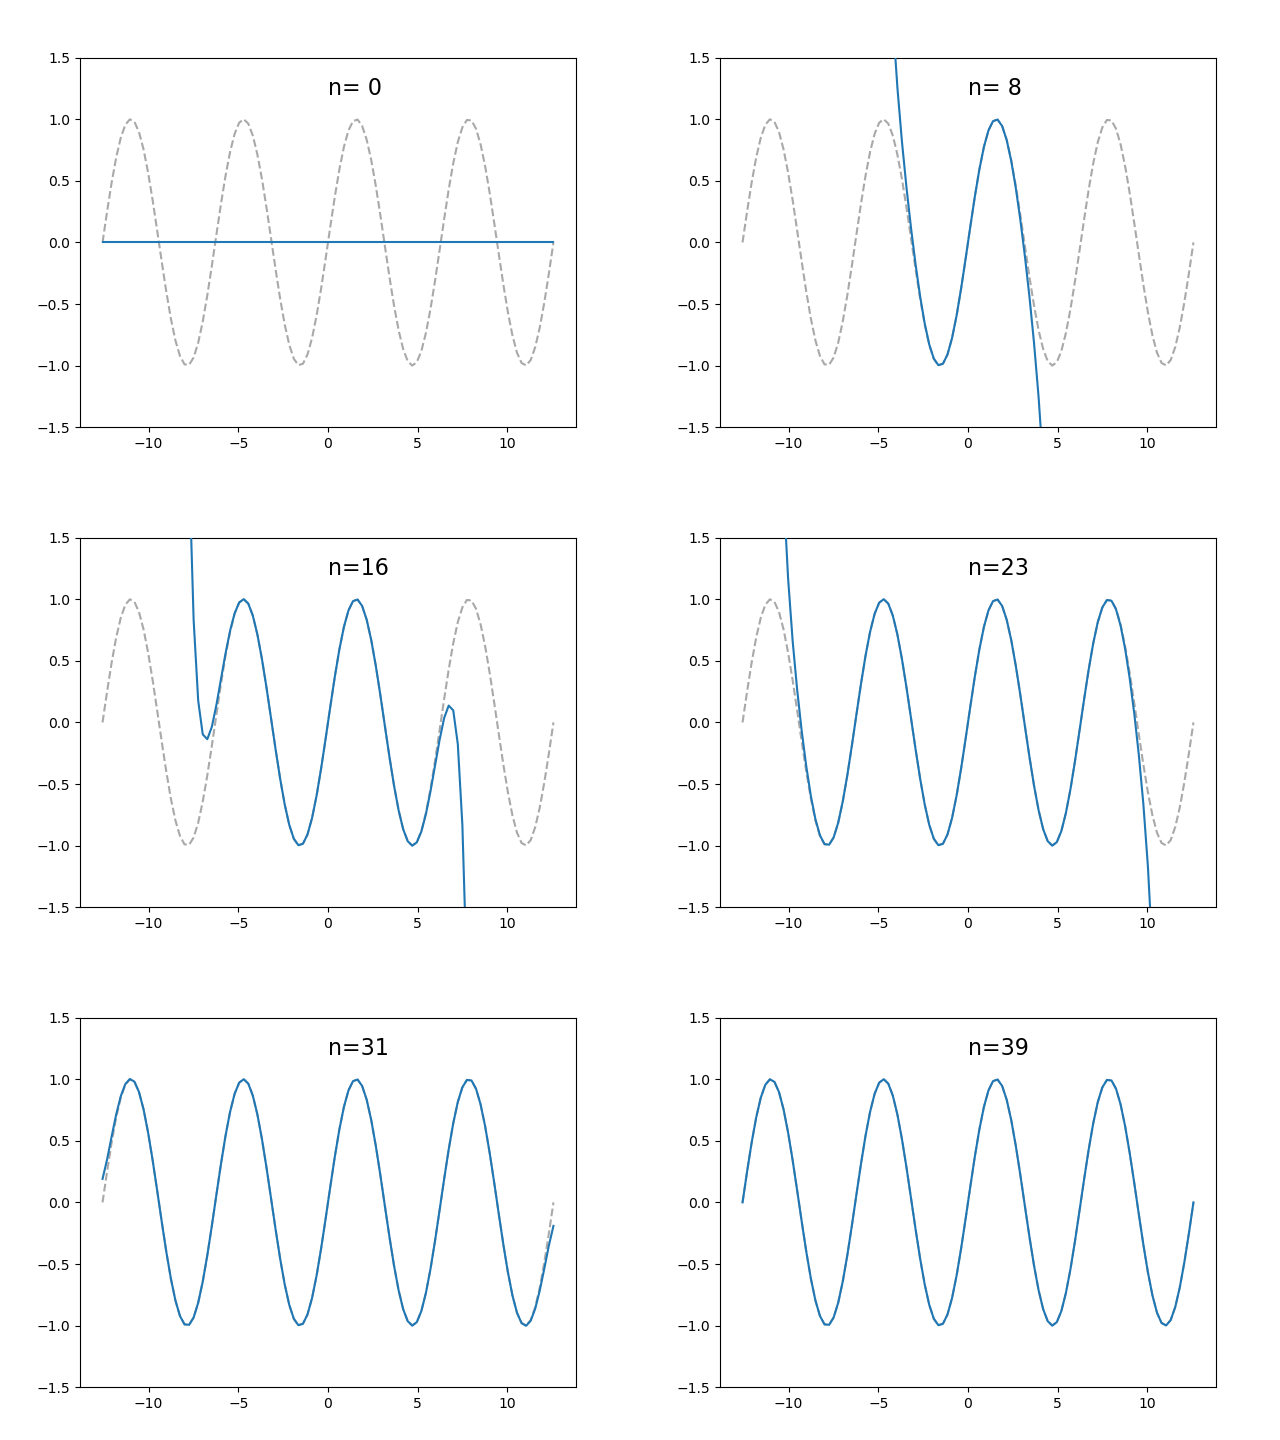
GIFアニメーション GIF animation

のマクローリン展開には奇数番目の項しかないため、
が2増えるごとに近似がよくなっていることが、アニメーションからも見て取れる。
Since Maclaurin series of contains only even terms, GIf animation shows that the approximate accuracy improves when
increases 2.
ソースコード Source code
実行にはImageMagickのインストールが必要。
Execution of the following code is required to install ImageMagick.
import math

import numpy as np
import matplotlib.pyplot as plt
import matplotlib.animation as animation
from tqdm import tqdm


def calc_maclaurin_series_of_expx(x, n):
    result = 0
    for k in range(n + 1):
        if k % 2 == 0:
            continue
        elif k % 4 == 1:
            result = result + x**k / math.factorial(k)
        else:
            result = result - x**k / math.factorial(k)
    return result


def main():
    n_max = 40
    fig = plt.figure()
    x = np.linspace(-4 * math.pi, 4 * math.pi, 100)

    def plot(n):
        plt.cla()
        y = np.ones_like(x) * np.nan
        for i in range(len(x)):
            y[i] = calc_maclaurin_series_of_expx(x=x[i], n=n)
        plt.plot(x, y, color='C0', zorder=5)
        plt.plot(x, np.sin(x), color='darkgray', linestyle='dashed', zorder=4)
        plt.ylim(-1.5, 1.5)
        plt.text(x=0.0, y=1.2, s='n={:>2d}'.format(n), fontsize=16)

    anim = animation.FuncAnimation(
        fig, plot, interval=300, repeat_delay=2000, frames=n_max
    )
    anim.save('anim2.gif', writer="imagemagick")
    return


if __name__ == '__main__':
    main()