[Python][Matplotlib] 枠・軸を削除する・目盛りのトゲを削除する(Removing frames, axes and ticks)
目次 Contents
ふつうに図を描く Plot with no options
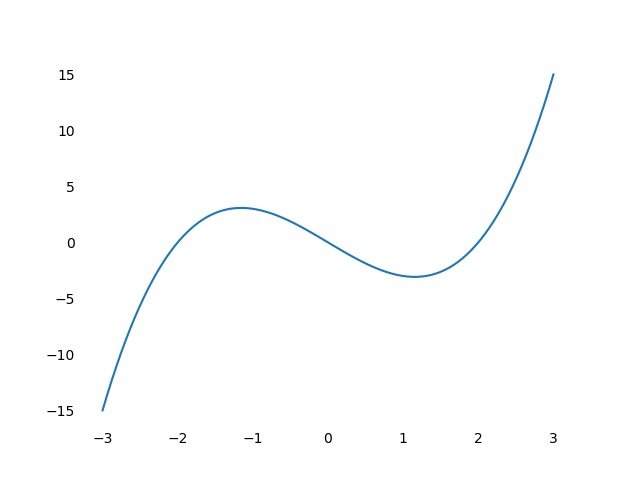
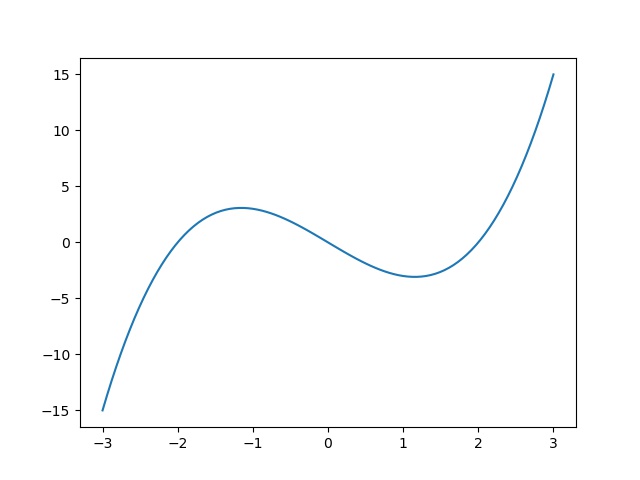
Matplotlibを使ってふつうに図を描くと
- 枠・軸が四方に表示される
- 目盛りにはその位置を示すためのトゲ(tick)が表示される
この二つを消す方法を下で説明する.
When we plot a figure with no options using Matplotlib package,
- the frame and axes are shown, and
- the ticks are shown.
Here, I'll explain how to remove the above two parts.
import os.path

import numpy as np
import matplotlib.pyplot as plt


def main():
    x = np.linspace(-3, 3, 100)
    fig, ax = plt.subplots()
    y = (x - 2) * (x + 2) * x
    ax.plot(x, y)

    fig.savefig(os.path.splitext(os.path.basename(__file__))[0] + '.jpg')
    return


if __name__ == '__main__':
    main()
枠・軸を消す Remove the frame and axes
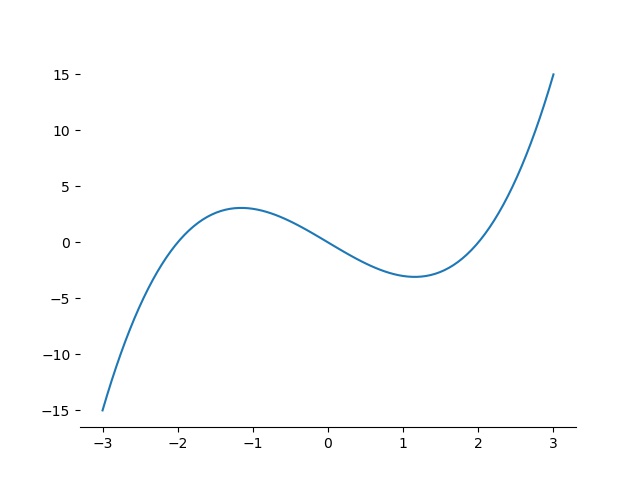
部分的に消す Partially remove the frame and axes
import os.path

import numpy as np
import matplotlib.pyplot as plt


def main():
    x = np.linspace(-3, 3, 100)
    fig, ax = plt.subplots()
    y = (x - 2) * (x + 2) * x
    ax.plot(x, y)

    ax.spines['right'].set_visible(False)
    ax.spines['top'].set_visible(False)
    ax.spines['left'].set_visible(False)

    fig.savefig(os.path.splitext(os.path.basename(__file__))[0] + '.jpg')
    return


if __name__ == '__main__':
    main()
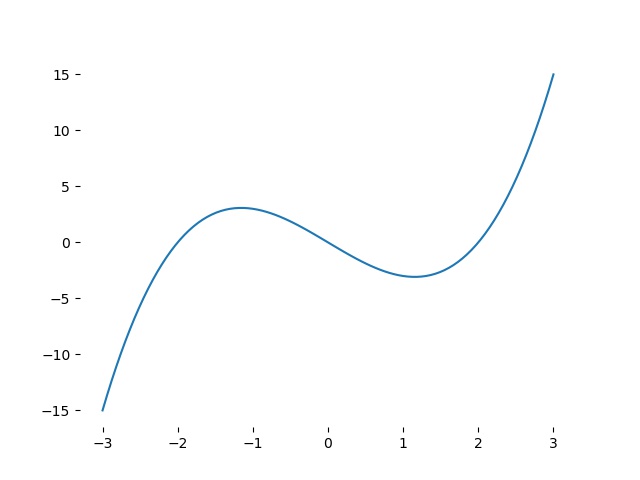
すべて消す Entirely remove the frame and axes
import os.path

import numpy as np
import matplotlib.pyplot as plt


def main():
    x = np.linspace(-3, 3, 100)
    fig, ax = plt.subplots()
    y = (x - 2) * (x + 2) * x
    ax.plot(x, y)

    ax.spines['right'].set_visible(False)
    ax.spines['top'].set_visible(False)
    ax.spines['bottom'].set_visible(False)
    ax.spines['left'].set_visible(False)

    fig.savefig(os.path.splitext(os.path.basename(__file__))[0] + '.jpg')
    return


if __name__ == '__main__':
    main()
目盛りのトゲを消す Remove the ticks
部分的に消す Partially remove the ticks
import os.path

import numpy as np
import matplotlib.pyplot as plt


def main():
    x = np.linspace(-3, 3, 100)
    fig, ax = plt.subplots()
    y = (x - 2) * (x + 2) * x
    ax.plot(x, y)

    ax.spines['right'].set_visible(False)
    ax.spines['top'].set_visible(False)
    ax.spines['bottom'].set_visible(False)
    ax.spines['left'].set_visible(False)
    ax.tick_params('y', length=0, which='major')

    fig.savefig(os.path.splitext(os.path.basename(__file__))[0] + '.jpg')
    return


if __name__ == '__main__':
    main()
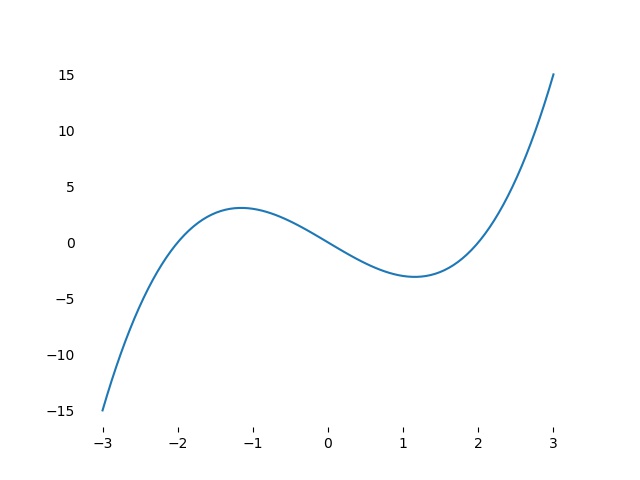
すべて消す Entirely remove the ticks
import os.path

import numpy as np
import matplotlib.pyplot as plt


def main():
    x = np.linspace(-3, 3, 100)
    fig, ax = plt.subplots()
    y = (x - 2) * (x + 2) * x
    ax.plot(x, y)

    ax.spines['right'].set_visible(False)
    ax.spines['top'].set_visible(False)
    ax.spines['bottom'].set_visible(False)
    ax.spines['left'].set_visible(False)
    ax.tick_params('x', length=0, which='major')
    ax.tick_params('y', length=0, which='major')

    fig.savefig(os.path.splitext(os.path.basename(__file__))[0] + '.jpg')
    return


if __name__ == '__main__':
    main()
